
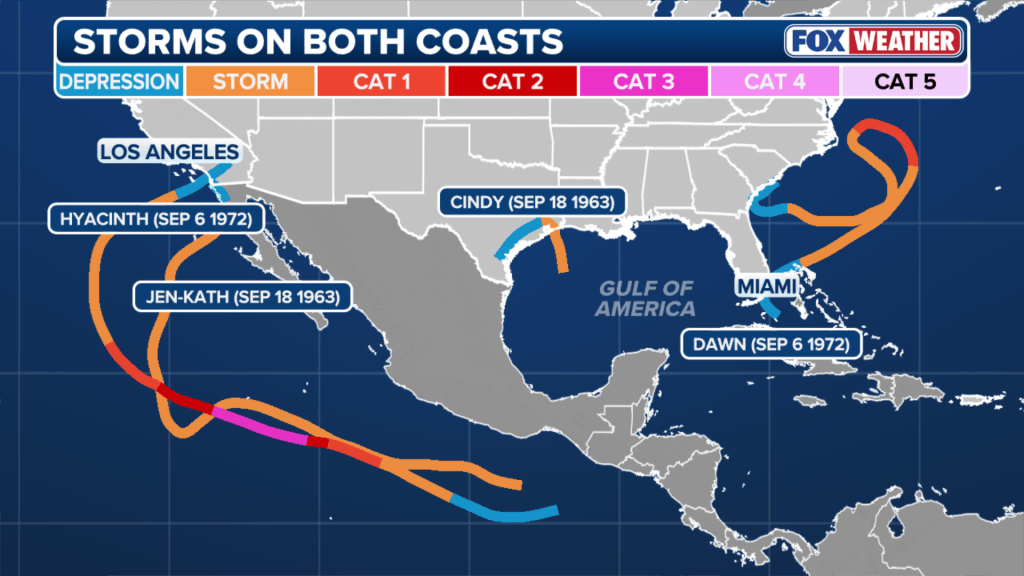
Map showing the only other times storms hit both coasts simultaneously. Source: https://www.foxweather.com/weather-news/rare-tale-two-coasts-unfolds-tropical-systems-target-gulf-west-coast#google_vignette
Last night, Hurricane Isaias made landfall on the Florida Panhandle as a category 2 hurricane. As of 8am this morning, over 900,000 people are without power and states in the storm’s path are preparing for tornadoes. At the same time, the Pacific Coast is also preparing for extreme weather: Tropical Storm Rachel is expected to make landfall near San Diego later today and Hurricane Simon is threatening Southern Mexico. The co-occurence of extreme storms that require hurricane advisories is extremely rare: the map above shows the paths of previous simultaneous storm patterns (from 1962 and 1972).
These storms are hitting during the so-called Godzilla El Niño while we are less than a month before the midterm elections and early voting is currently underway in many states.
Although extreme events like storms are not inherently political, they are made political by what is causing them (ie climate change), as well as the ways that people are affected by storms and supported post disaster (I talk about this issue some in my just released conversation: ‘Why VIP climate shocks aren’t the worst thing’ on the Climate Curious Podcast). Remember that the term “frontline communities” refers to the well documented fact that historically marginalized communities tend to experience the consequences of climate change (including extreme events) as well as other injustices at higher rates.
While the first Trump Administration withheld disaster aid to states he considered ‘politically hostile,’ the second Trump Administration has been even more aggressive in its tactics. In addition to limiting disaster aid substantially, disaster assistance is being disproportionately distributed. I recently discovered the FEMA Disaster Declaration Dashboard, which is run by Andrew Rumbach who co-leads the Climate and Communities Program at the Urban Institute. (The dashboard is a treasure trove of information so definitely give it a look!)
I was particularly taken by these statistics that are listed on the front page of the dashboard and expose clear patterns in FEMA funding under the current Trump Administration: while 85% of requests for federal assistance have been approved in states that went for Trump in the 2024 election, only 46% of requests have been approved in states that went for Harris. Moreover, in states that supported Donald Trump for president in 2024, the days to decision on requests for aid is less than half of the wait for states that went for Kamala Harris (51 versus 108 days).
As we witness the effects of these events on both coasts, everyone should be paying attention to what comes after the storms. In particular, how are the affected communities supported as they work to respond to and recover from these extreme events. (For anyone looking for how best to support communities affected by these storms, I suggest you check out and support the amazing work by Rebuild.US).

